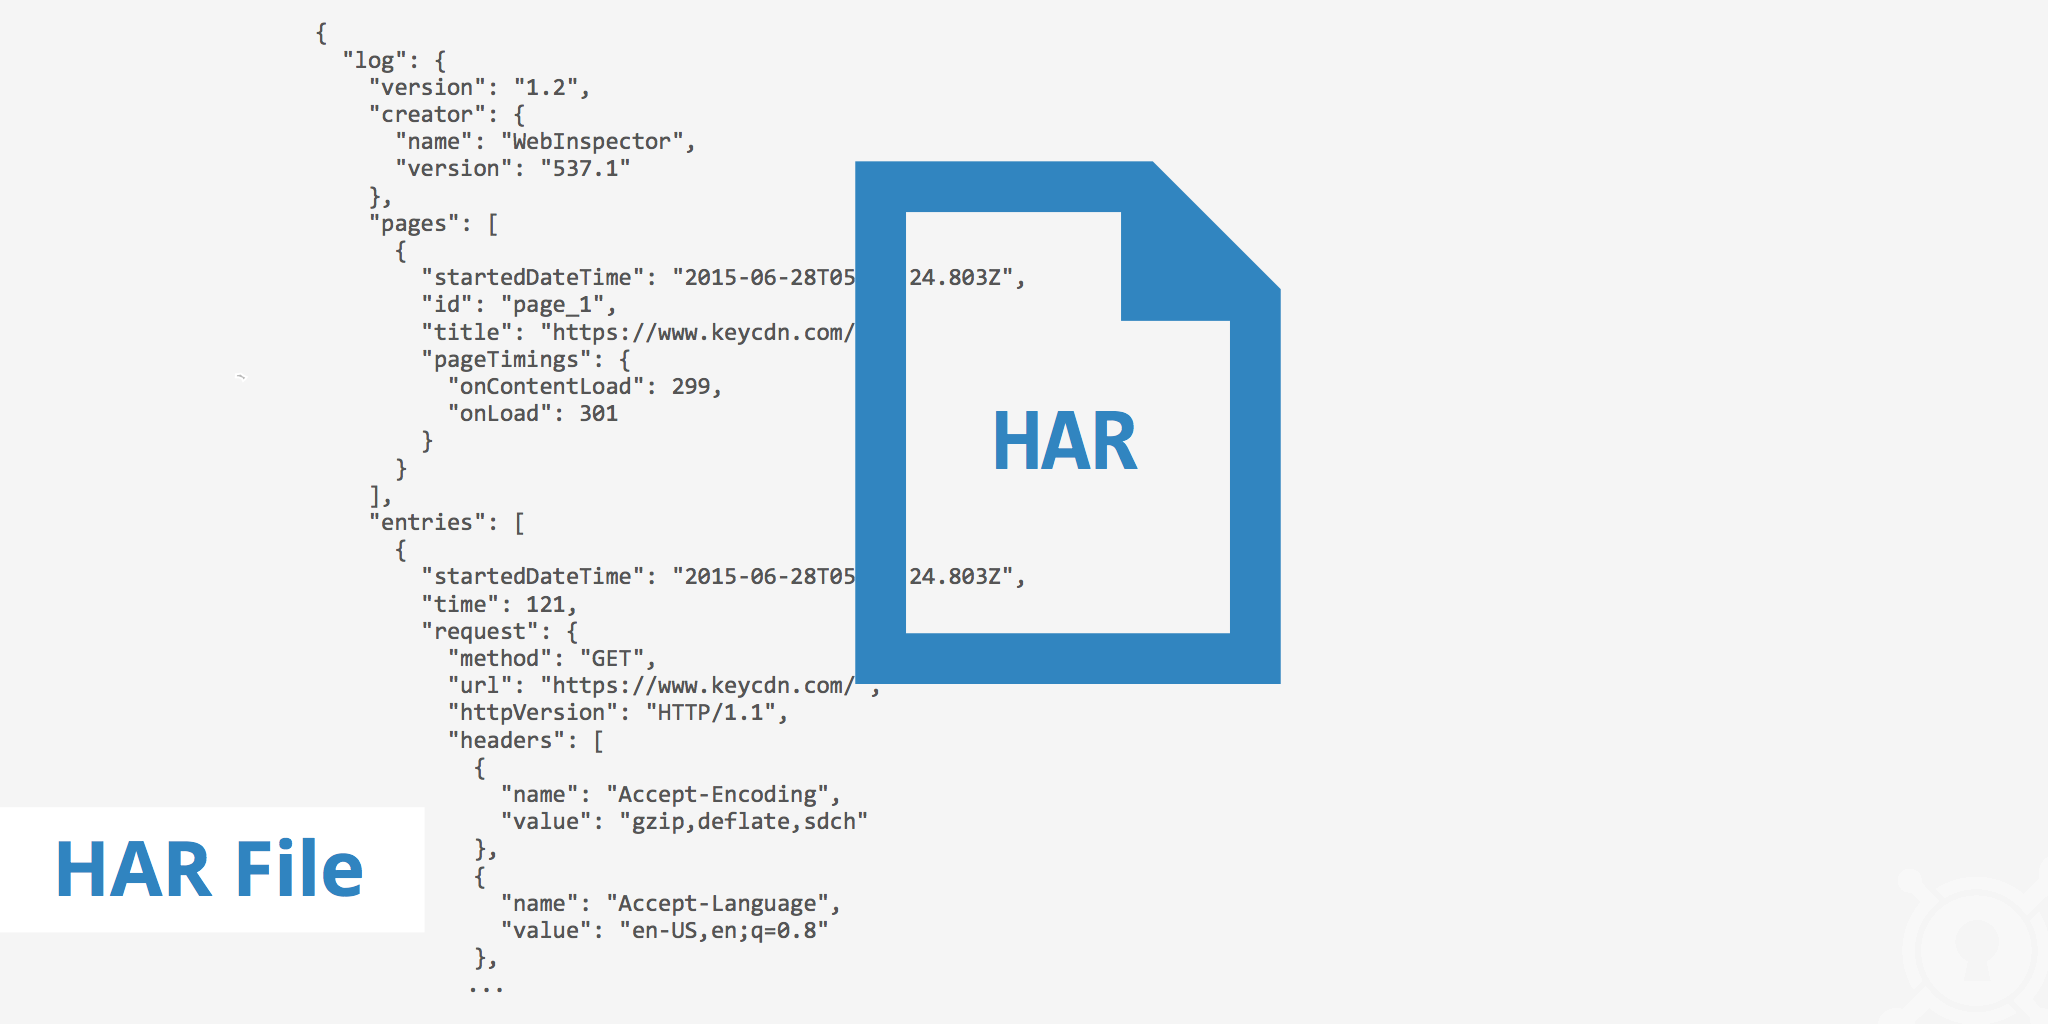
What is a HAR file?
HAR stands for HTTP Archive and is a container for lots of trace information from within a browser. It records all web requests made by the browser tab, including the request & response headers, the body and the time it look to load. This makes HAR files very useful when troubleshooting issues relating to speed, caching and issues which are harder to replicate.
Security warning:
A HAR file captures all information a user submits via a web page while network traffic is being recorded. This can include passwords, payment information, and private keys. Be cautious when generating a HAR file that includes this information, and never send a HAR file with sensitive information over email. You can manually remove all sensitive information using a text editor.
How to generate one
Currently, only two browsers have the feature built in, others need an add-on or extension, or can’t do this at all. When installing an add-on or extension, follow the instructions given by the browser, and make sure you understand the implications, especially in terms of performance and security.
In Chrome
1. Browse to the URL where you are seeing the issue.
2. Right click anywhere on the page and click on Inspect Element.
3. The developer tools should have opened at the bottom of the browser, now click on the Network tab.
4. Click on the record button and force a refresh of the page, or click on a link with which you are seeing the issue. The aim is to reproduce the issue and capture the output.
5. Once you have experienced the issue, right click on any of the items within the Network tab and select “Save as HAR with Content” then save the file.
6. Now you can upload the output file to your support ticket or attach it to an email response.
In Firefox
1. Browse to the URL where you are seeing the issue.
2. Navigate to the Tools > Web Developer > Network menu or press Ctrl+Shift+I (Windows/Linux) or Cmd+Option+I (OS X)
3. Refresh the page to start capturing the traffic between the browser to the server, or click on a link with which you are seeing the issue. The aim is to reproduce the issue and capture the output.
4. Click on Export followed by Save As… to save the HAR file.
In Internet Explorer (after version 11)
Internet Explorer doesn’t have the ability to build HAR files, but a similar functionality is described on Microsoft Developer Network here. Follow the instructions and send us the resulting XML or CSV file.
In Microsoft Edge
1. Browse to the URL where you are seeing the issue.
2. Navigate to Developer tools (use F12 as a shortcut) and select the “Network” tab.
3. Refresh the page to start capturing the traffic between the browser to the server, or click on a link with which you are seeing the issue. The aim is to reproduce the issue and capture the output.
4. Click on “Export as HAR” followed by Save As… to save the HAR file.
In Safari
1. In Safari, first look to see if you have a “Develop” menu at the top of the screen. If not, go to Safari > Preferences > Advanced and check “Show Develop Menu in menu bar”
2. Browse to the URL where you are seeing the issue.
3. Navigate to Develop > Show Web Inspector. Note: this menu option will not be available until you browse somewhere beyond Safari’s starting page.
4. Refresh the page to start capturing the traffic between the browser to the server, or click on a link with which you are seeing the issue. The aim is to reproduce the issue and capture the output.
5. Control + click on the resource that you want to capture the HAR file for, and click “Export HAR”.
